News Article
Renewables continue to add to US energy mix

The Annual Energy Outlook 2013 (AEO2013) Reference case released by the U.S. Energy Information Administration (EIA) presents updated projections for U.S. energy markets through 2040. These projections include only the effects of policies that have been implemented in law or final regulations.
"EIA's updated Reference case shows how evolving consumer preferences, improved technology, and economic changes are pushing the nation toward more domestic energy production, greater vehicle efficiency, greater use of clean energy and reduced energy imports," said EIA Administrator Adam Sieminski. "This combination has markedly reduced projected energy-related carbon dioxide emissions," said Mr. Sieminski.
Some key findings:
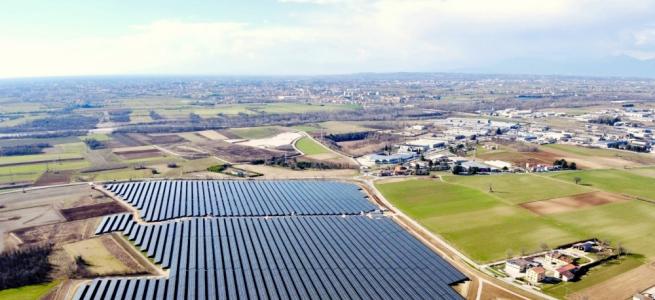
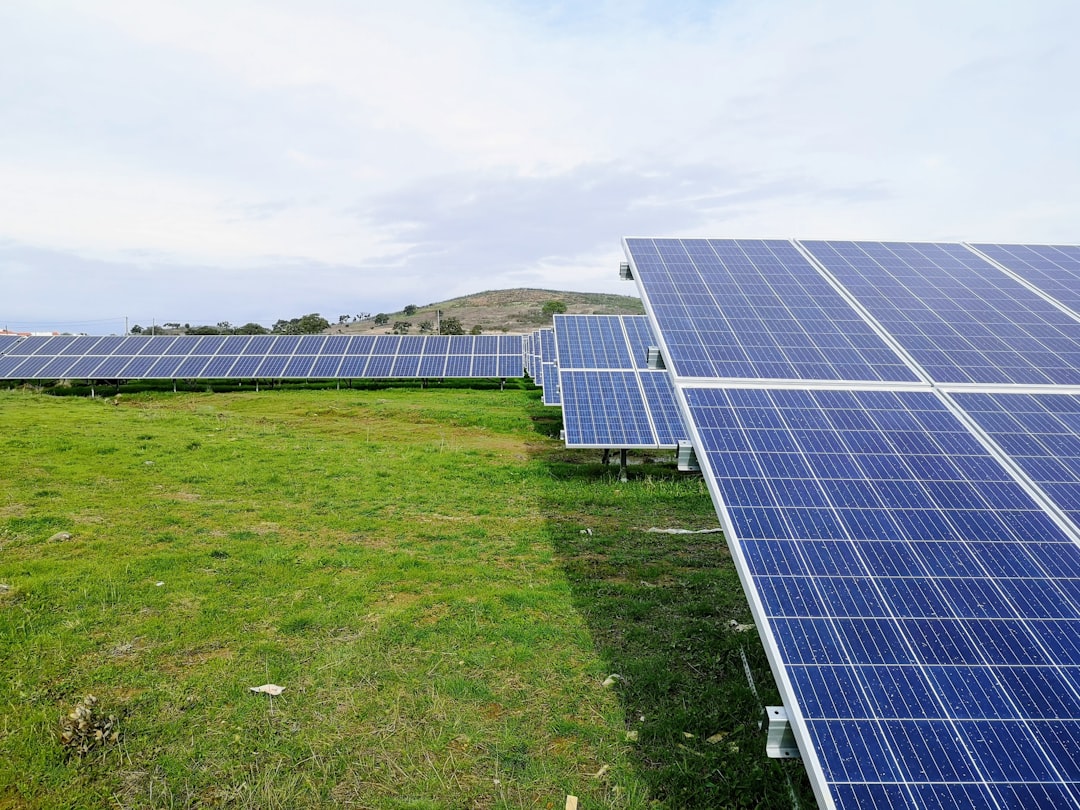
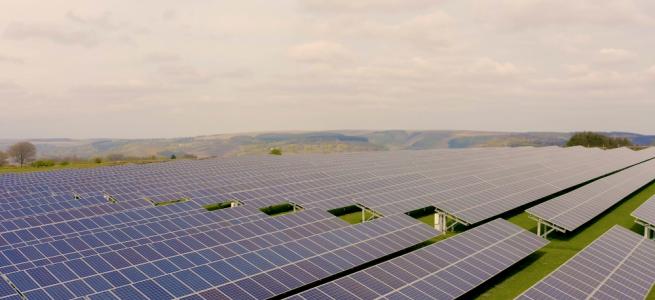
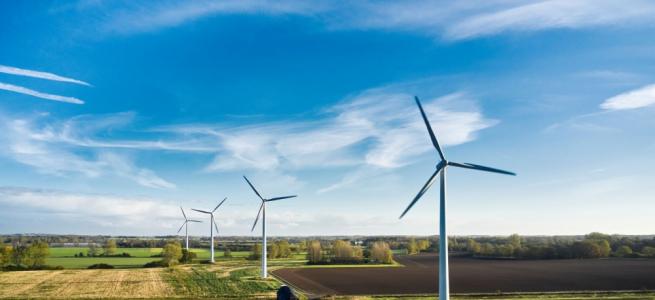
Renewable fuel use grows at a much faster rate than fossil fuel use. The share of electricity generation from renewables grows from 13 percent in 2011 to 16 percent in 2040. Electricity generation from solar and, to a lesser degree, wind energy sources grows as recent cost declines make them more economical. However, the AEO2013 projection is less optimistic about the ability of advanced biofuels to capture a rapidly growing share of the liquid fuels market than AEO2012. As a result, biomass use in AEO2013 totals 4.2 quadrillion Btu by 2035 (compared to 5.4 quadrillion Btu in AEO2012) and 4.9 quadrillion Btu in 2040, up from 2.7 quadrillion Btu in 2011.
Crude oil production, particularly from tight oil plays, rises sharply over the next decade. The advent and continuing improvement of advanced crude oil production technologies continues to increase projected domestic supply. Domestic production of crude oil increases sharply in AEO2013, with an annual growth averaging 234 thousand barrels per day (bpd) from 2011 through 2019, when production reaches 7.5 million bpd (Figure 1). The growth results largely from a significant increase in onshore crude oil production, particularly from shale and other tight formations. After about 2020, production begins declining gradually to 6.1 million bpd in 2040 as producers develop sweet spots first and then move to less productive or less profitable drilling areas.
Motor gasoline consumption is lower in the AEO2013 relative to the level in AEO2012, reflecting the introduction of more stringent corporate average fuel economy (CAFE) standards; growth in diesel fuel consumption is moderated by increased use of natural gas in heavy-duty vehicles. AEO2013 incorporates the greenhouse gas (GHG) and CAFE standards for light-duty vehicles (LDVs) through the 2025 model year, which raise the new vehicle fuel economy requirement from 32.6 miles per gallon (mpg) in 2011 to 47.3 mpg in 2025. The increase in vehicle efficiency reduces gasoline use in the transportation sector by 0.5 million bpd in 2025 and by 1.0 million bpd in 2035 in AEO2013 compared to the AEO2012 Reference case (Figure 2). Furthermore, the improved economics of natural gas results in an increase in the use of liquefied natural gas (LNG) in heavy-duty vehicles that offsets a portion of diesel fuel consumption. The use of petroleum-based diesel fuel is also reduced by the increased use of diesel produced using gas-to-liquids (GTL) technology. Natural gas use in vehicles reaches 1.7 trillion cubic feet (including GTL) by 2040, displacing 0.7 million bpd of other motor fuels.
The United States becomes a larger exporter of natural gas than projected in the AEO2012 Reference case. U.S. natural gas production increases throughout the projection period (Figure 3), outpacing domestic consumption by 2020 and spurring net exports of natural gas. Higher volumes of shale gas production in AEO2013 are central to higher production volumes and an earlier transition to net exports than was projected in the AEO2012 Reference case. U.S. exports of LNG from domestic sources rise to approximately 1.6 trillion cubic feet in 2027, double the 0.8 trillion cubic feet projected in AEO2012; the United States becomes a net exporter of LNG in 2016.
With improved efficiency of energy use and a shift away from the most carbon-intensive fuels U.S. energy-related carbon dioxide (CO2) emissions remain more than 5 percent below their 2005 level through 2040. The projected growth rate for U.S. energy-related CO2 emissions has declined successively in each Annual Energy Outlook since AEO2005, reflecting both market and policy drivers (Figure 4). Emissions from motor gasoline demand in AEO2013 are lower than in AEO2012 as a result of the adoption of fuel economy standards, biofuel mandates, and shifts in consumer behavior. Emissions from coal use in the generation of electricity are lower as power generation shifts from coal to lower-carbon fuels, including natural gas and renewables. The story is somewhat more complex for natural gas. Emissions from natural gas use are higher in the industrial and electric power sectors in AEO2013 than in AEO2012 as a result of increased consumption; however, the increase is partially offset by lower emissions from natural gas use in the residential and commercial sectors in AEO2013 as a result of the implementation of efficiency standards for energy-using equipment and other changes that affect demand.